Visualizations
Installation
To create state machine graphs you must install automat with the graphing dependencies.
pip install automat[visualize]
To generate images, you will also need to install Graphviz for your platform, such as with brew install
graphviz on macOS or apt install graphviz on Ubuntu.
Example
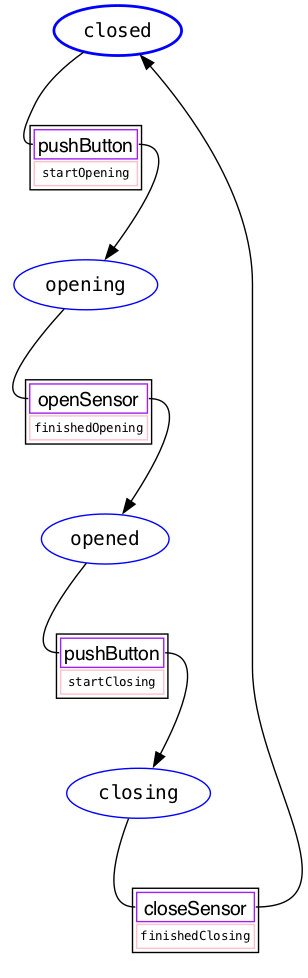
If we put the garage door example from the tutorial into a file called garage_door.py,
You can generate a state machine visualization by running:
$ automat-visualize garage_door
garage_door.machineFactory ...discovered
garage_door.machineFactory ...wrote image and dot into .automat_visualize
The dot file and png will be saved in the default output directory, to the
file .automat_visualize/garage_door.machineFactory.dot.png .
automat-visualize help
$ automat-visualize -h
usage: /home/tom/Envs/tmp-72fe664d2dc5cbf/bin/automat-visualize
       [-h] [--quiet] [--dot-directory DOT_DIRECTORY]
       [--image-directory IMAGE_DIRECTORY]
       [--image-type {gv,vml,dot_json,imap_np,pov,tiff,pic,canon,jpg,ismap,sgi,webp,gd,json0,ps2,cmapx_np,plain-ext,wbmp,xdot_json,ps,cgimage,ico,gtk,pct,gif,json,fig,xlib,xdot1.2,tif,tk,xdot1.4,svgz,gd2,jpe,psd,xdot,bmp,jpeg,x11,cmapx,jp2,imap,png,tga,pict,plain,eps,vmlz,cmap,exr,svg,pdf,vrml,dot}]
       [--view]
       fqpn


Visualize automat.MethodicalMachines as graphviz graphs.

positional arguments:
  fqpn                  A Fully Qualified Path name representing where to find
                        machines.

optional arguments:
  -h, --help            show this help message and exit
  --quiet, -q           suppress output
  --dot-directory DOT_DIRECTORY, -d DOT_DIRECTORY
                        Where to write out .dot files.
  --image-directory IMAGE_DIRECTORY, -i IMAGE_DIRECTORY
                        Where to write out image files.
  --image-type {gv,vml,dot_json,imap_np,pov,tiff,pic,canon,jpg,ismap,sgi,webp,gd,json0,ps2,cmapx_np,plain-ext,wbmp,xdot_json,ps,cgimage,ico,gtk,pct,gif,json,fig,xlib,xdot1.2,tif,tk,xdot1.4,svgz,gd2,jpe,psd,xdot,bmp,jpeg,x11,cmapx,jp2,imap,png,tga,pict,plain,eps,vmlz,cmap,exr,svg,pdf,vrml,dot}, -t {gv,vml,dot_json,imap_np,pov,tiff,pic,canon,jpg,ismap,sgi,webp,gd,json0,ps2,cmapx_np,plain-ext,wbmp,xdot_json,ps,cgimage,ico,gtk,pct,gif,json,fig,xlib,xdot1.2,tif,tk,xdot1.4,svgz,gd2,jpe,psd,xdot,bmp,jpeg,x11,cmapx,jp2,imap,png,tga,pict,plain,eps,vmlz,cmap,exr,svg,pdf,vrml,dot}
                        The image format.
  --view, -v            View rendered graphs with default image viewer

You must have the graphviz tool suite installed. Please visit
http://www.graphviz.org for more information.